Analytics and consumption
Clever Cloud’s billing is based on several types of products: applications (Java, PHP, Jenkins, etc.), managed services (MySQL, PostgreSQL, etc.), storage services (via FTP with FS Buckets, or via the S3 protocol with Cellar) and other services (Heptapod, Pulsar, etc).
Billing calculation
The calculation of consumption is based on the second of running. Once your monthly bill has been generated, you can refer to it to find out by service:
- the size of the instances used
- the execution time
- the unit price per second
- the total monthly amount
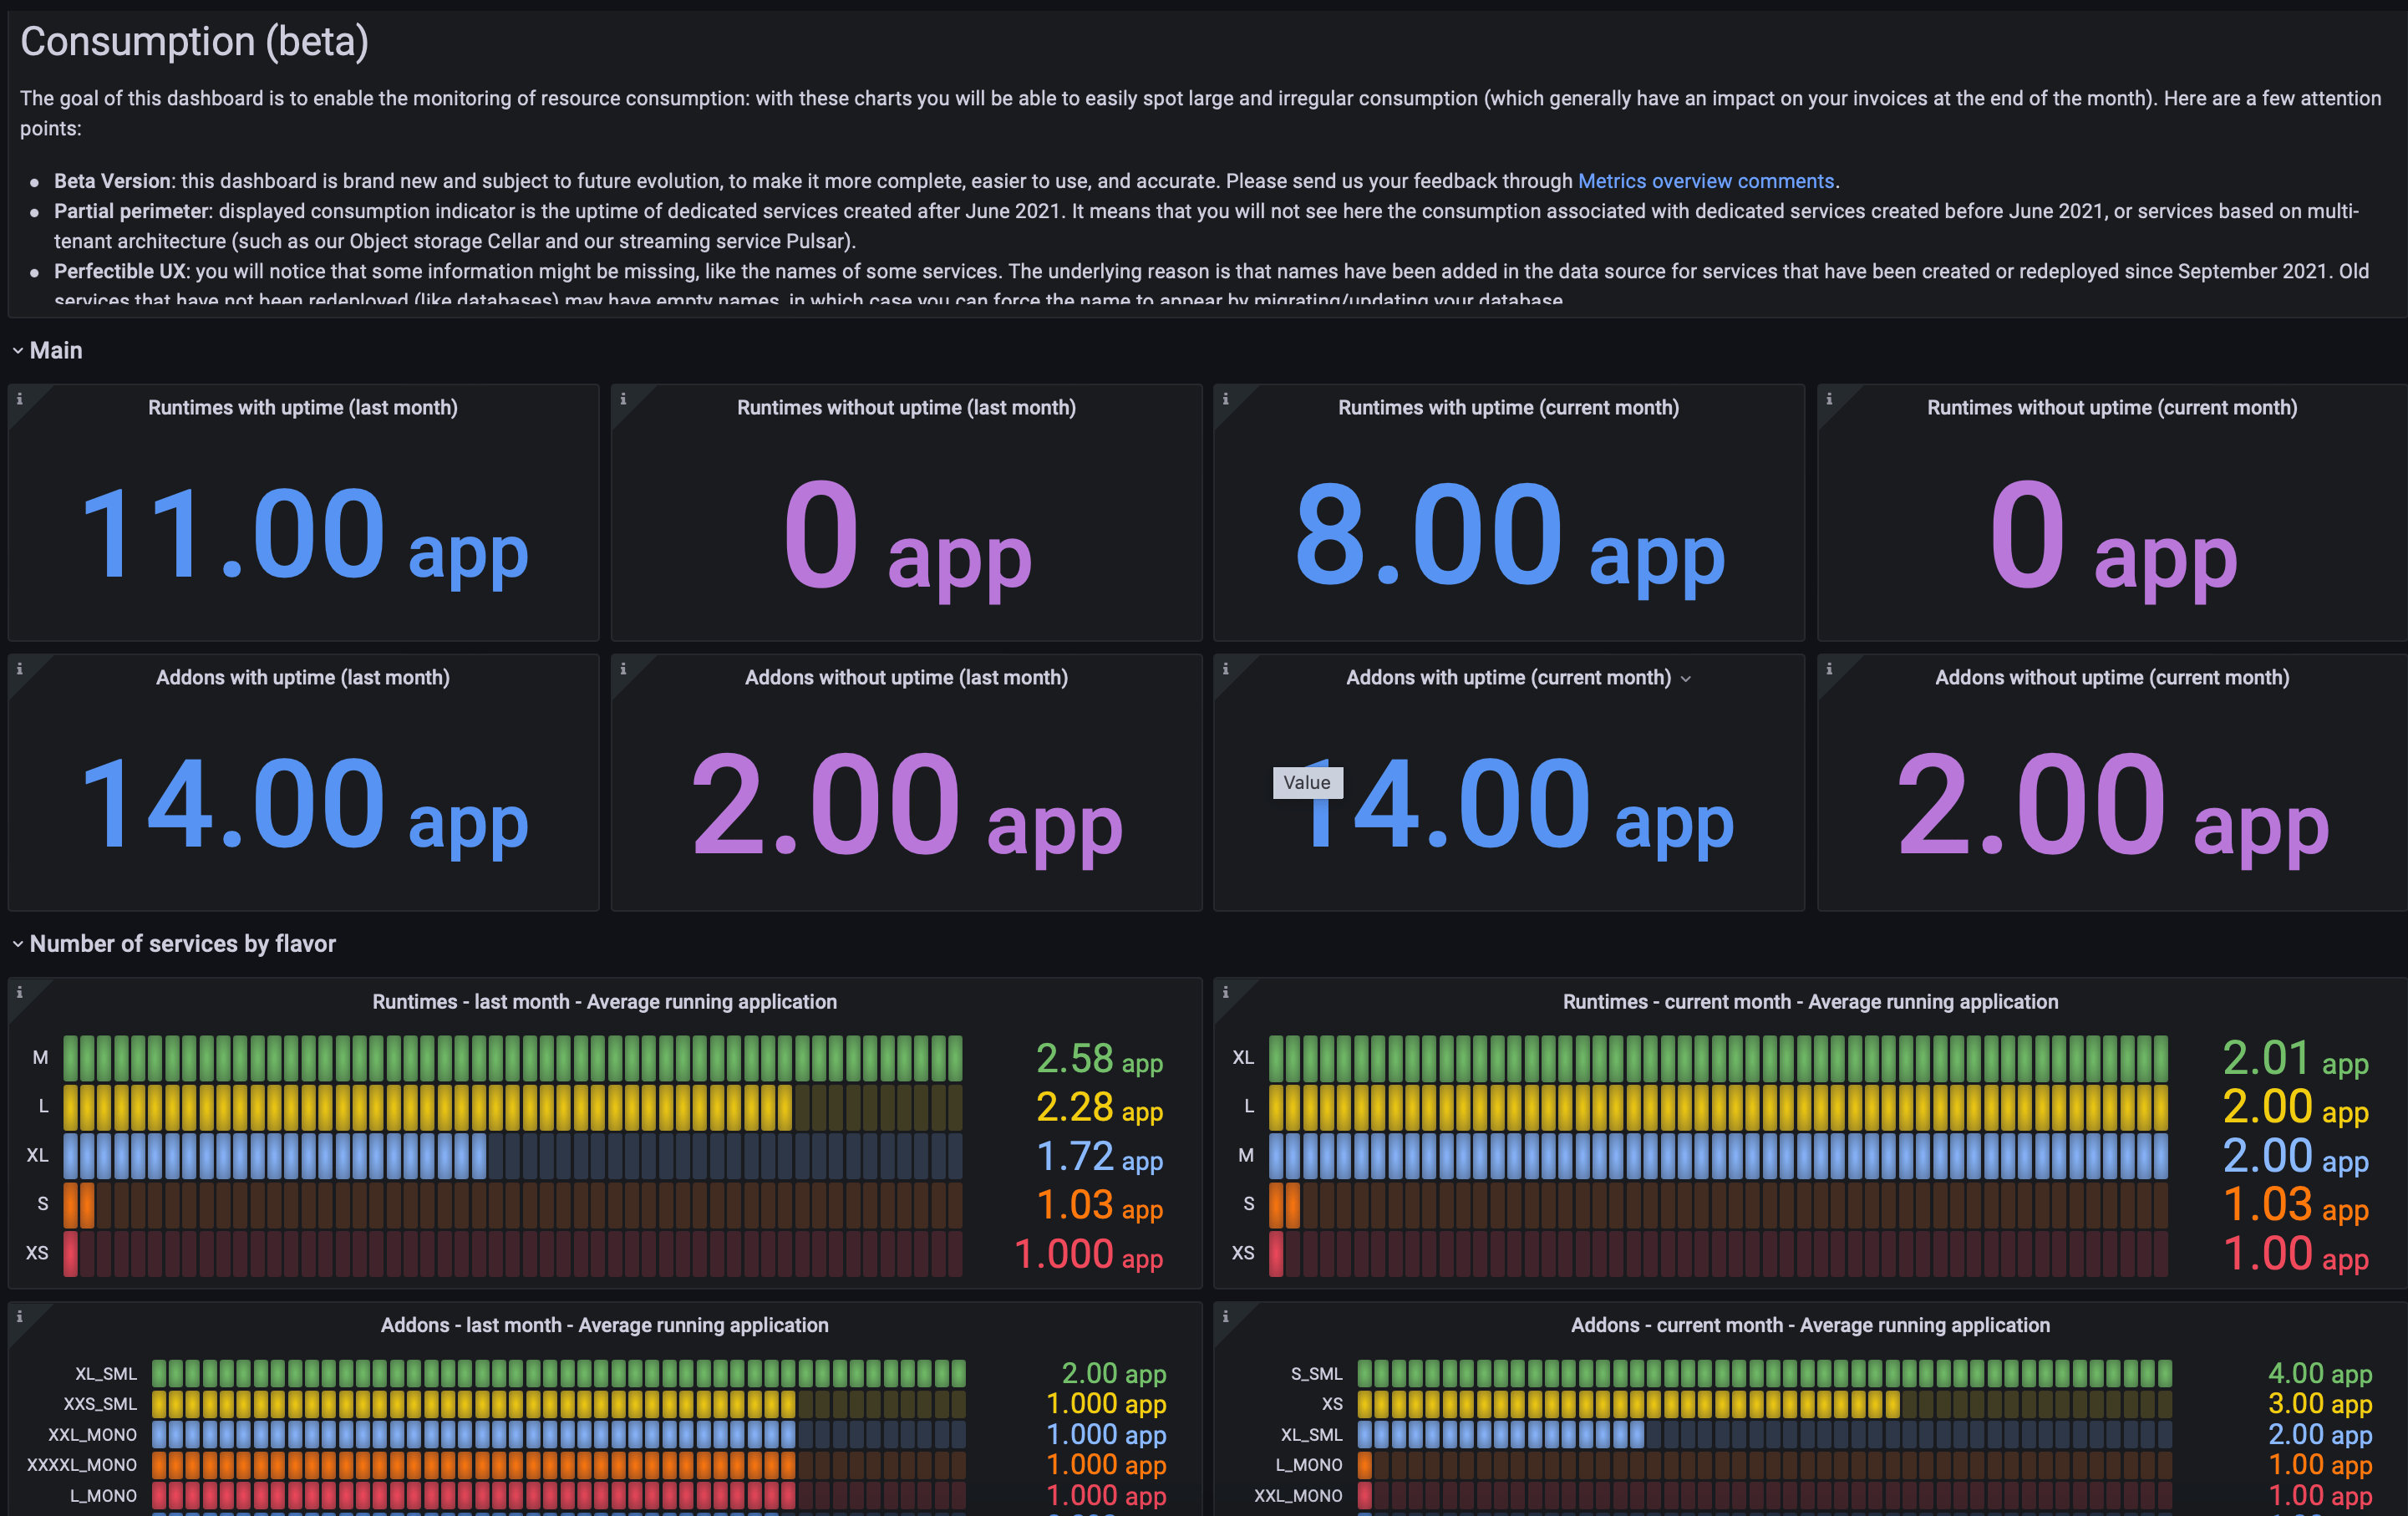
To find your consumption history, it is visible in the Metrics in Grafana service via a specific Grafana dashboard. This is called the Uptime Service.
Upscale & Downscale Impacts
If the auto-scalability option is activated, it is possible that the size of the instances of your applications will vary during the month. This variation will not be systematically identical from one month to the next, which explains the variation in the amount of your bills.
Most of our cutomers apps running with auto-scaling enabled have less than a ±5% variation between consecutive months in their invoice. Especially because upscale events don’t last for long before a downscale occurs, usually after 2-3 hours. High traffic is most of the time temporary (a newsletter sendings, a TV show appearance, Techcrunch effect etc.).
In the end, auto-scaling is pretty useful to avoid applications slowdown without a significant impact on your billing.